Setting up a long-term evaluation environment for interactive semi-public information displays
Abstract
Human-computer interaction research increasingly focuses on the long-term evaluation of real-world field deployments. When dealing with innovative solutions and when asking for the possibility to do action research in the deployment, fitting real-world deployments are hard to find – and access to these deployments is hard to obtain. We decided to invest in setting up and managing a long-term deployment of an interactive large information screen solution at our university, which includes several displays. In this paper, we briefly report about the installation – the CommunityMirror Network – as well as its functionality and operations management.
Keywords
deployment, field studies, long-term evaluation, ambient displays, in-the-wild, CommunityMirror, sustainability
1. Introduction
In the CommunityMirror project1 we have been working for several years on identifying success factors for large interactive public and semi-public screens acting as information displays.
CommunityMirrors are large interactive screens extending the benefits of social software for knowledge work beyond the physical barriers of single user desktops [8]. CommunityMirrors are peripherally recognizable “information radiators” [3] that show “info particles” from existing enterprise IT systems (getting the information “out of the box” from existing sources). The screens can be installed in different semi-public places, e.g. beside the elevator, in the coffee corner, in the corridors, or in other social areas where people come together.
As supplements to classic desktops (not replacements!), the interfaces can help create visibility about what is going on in the organization (awareness) and facilitate the “accidental” discovery of relevant information without having to explicitly look for it (serendipity). The re-integration of information objects into their social surrounding enables people to directly talk about the discovered information without computer mediation. The additional interfaces can help efficiently generate a better “common ground” [2] for successful collaboration.
As described elsewhere (e.g. Alt et al. [1]), it is important to run long-term deployments for addressing some types of research questions. In the CommunityMirror project we have been working with several shorter deployments for years – but always had to deal with the novelty effect [5] and problems with the non-professionalism of the (research) deployments. The only professional deployment where we had closer access was Ott and Koch [9] which showed the problems with limited access and influence on outside deployments.
So, we decided to invest in setting up and managing a long-term, in-the-wild, real-world deployment of an interactive large information screen solution at our university. We started operating the first two screens in 2018 and added two more in 2019, then paused due to the COVID-19 pandemic, and restarted operating the screens in mid 2022 – now with additional capturing of body tracking data [4] at two of the screens.
The goals of the setup were to research different factors in context without the novelty effect kicking in – and to research aspects of operating such a setup for a longer term.
In this paper we will briefly report on the setup of the “CommunityMirror Network” – a real-world deployment with four CommunityMirror instances at the University of the Bundeswehr Munich. By giving this long-term deployment example, we want to inspire discussions about operations management and field studies in ubiquitous human-computer interaction research.
1: see https://www.communitymirrors.net/
2. The CommunityMirror Network
Following the ideas of CommunityMirrors listed in the previous section we planned to set up an installation that presents relevant and valuable information to the community: the people working, studying, and visiting the Department of Informatics at the University of the Bundeswehr Munich. In the following subsections, we briefly describe what decisions we have made regarding data and data collection, user interface, and operation based on our experiences from former short-term deployments.
2.1. Data and Data Collection
When researching what information might be of interest to all interest groups – co-workers, students, and visitors – we came to three different types of information:
- People: information about people working in the Informatics Department, around the area of the installations.
- Organizations: information about (sub-)organizations within the department, as part of the university, and in general.
- Content: information about what the people in our department are working on, what is taking place (e.g. announcements (of events or other), reports or news, new publications, active (research) projects, announcements of topics for student theses, …).
In addition to the “serious” information, we added some non-serious content: photos from department events and comics, funny images and texts.
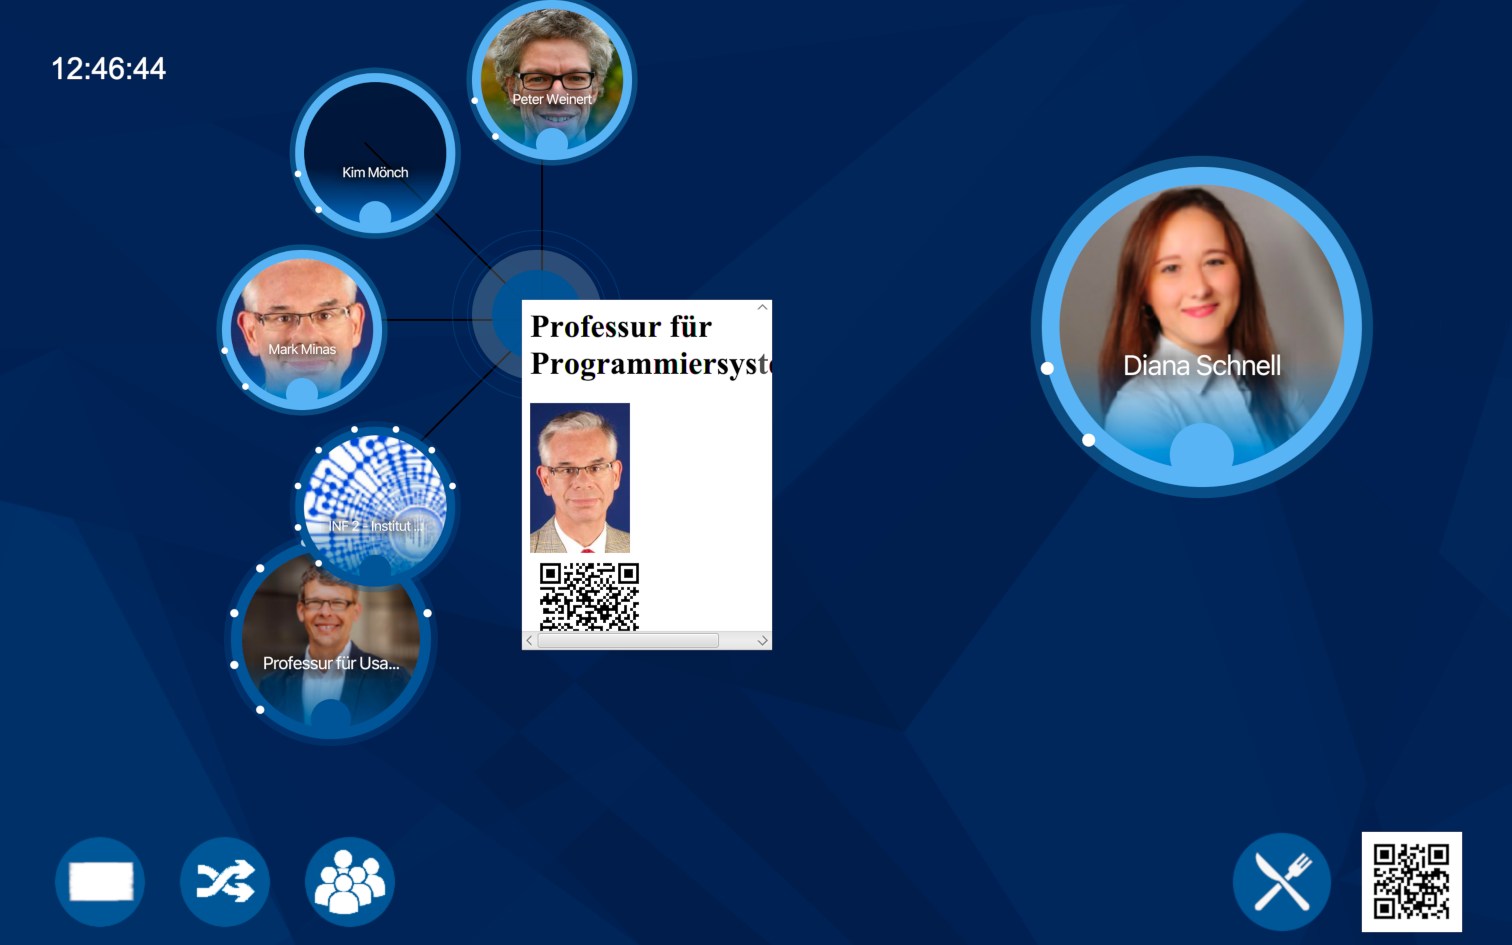
All these information items consist of a catchy title, an image (wherever possible), and a short abstract with links to further information on the web. Additionally, all the information items are linked to other information items to create an information graph for browsing. As an example, this can be seen in Figure 2.
As we learned in earlier deployments, this information has to be current and updated quite often to keep interest, and to sustain the usefulness of the screen [9]. So, we fell back to a data solution already used for shorter deployments before, the CommunityMashup [6, 7]. The CommunityMashup collects information from different sources and makes it available in a common format – based on the data types of users, organizations, and content.
2.2. Data Display and Interaction Possibilities
The touch screens in our installation access data from the same CommunityMashup data store, display the data, and allow interaction with it. To display user-centric data, each CommunityMirror uses selection strategies to choose appropriate data items, e.g. according to their location. For instance, the display located in the corridor of the Institute of Theoretical Informatics shows more info particles related to this specific institute. The core element in the user interface is an “information flow” that shows the selected data items as circles, in various sizes, showing the title and the image (see Figure 1). Depending on the data type the circles have a specific color: persons are light blue, organizations are dark blue and content items are green. These flow items move through the screen, from left to right or right to left, until they leave the screen which results in another item being selected and inserted in the flow. There is a maximum number of items displayed in the information flow at one time. To achieve a balance in the displayed data objects, there is an algorithm that always selects a certain percentage of each type of item and steers toward a specified balance.
Since we are interested in how often and in which way people interact with the CommunityMirror to explore the displayed information, we added functionality for capturing active and passive usage data – for scientific evaluations and for operation support. Our logging solution is described in more detail elsewhere [4, 10].
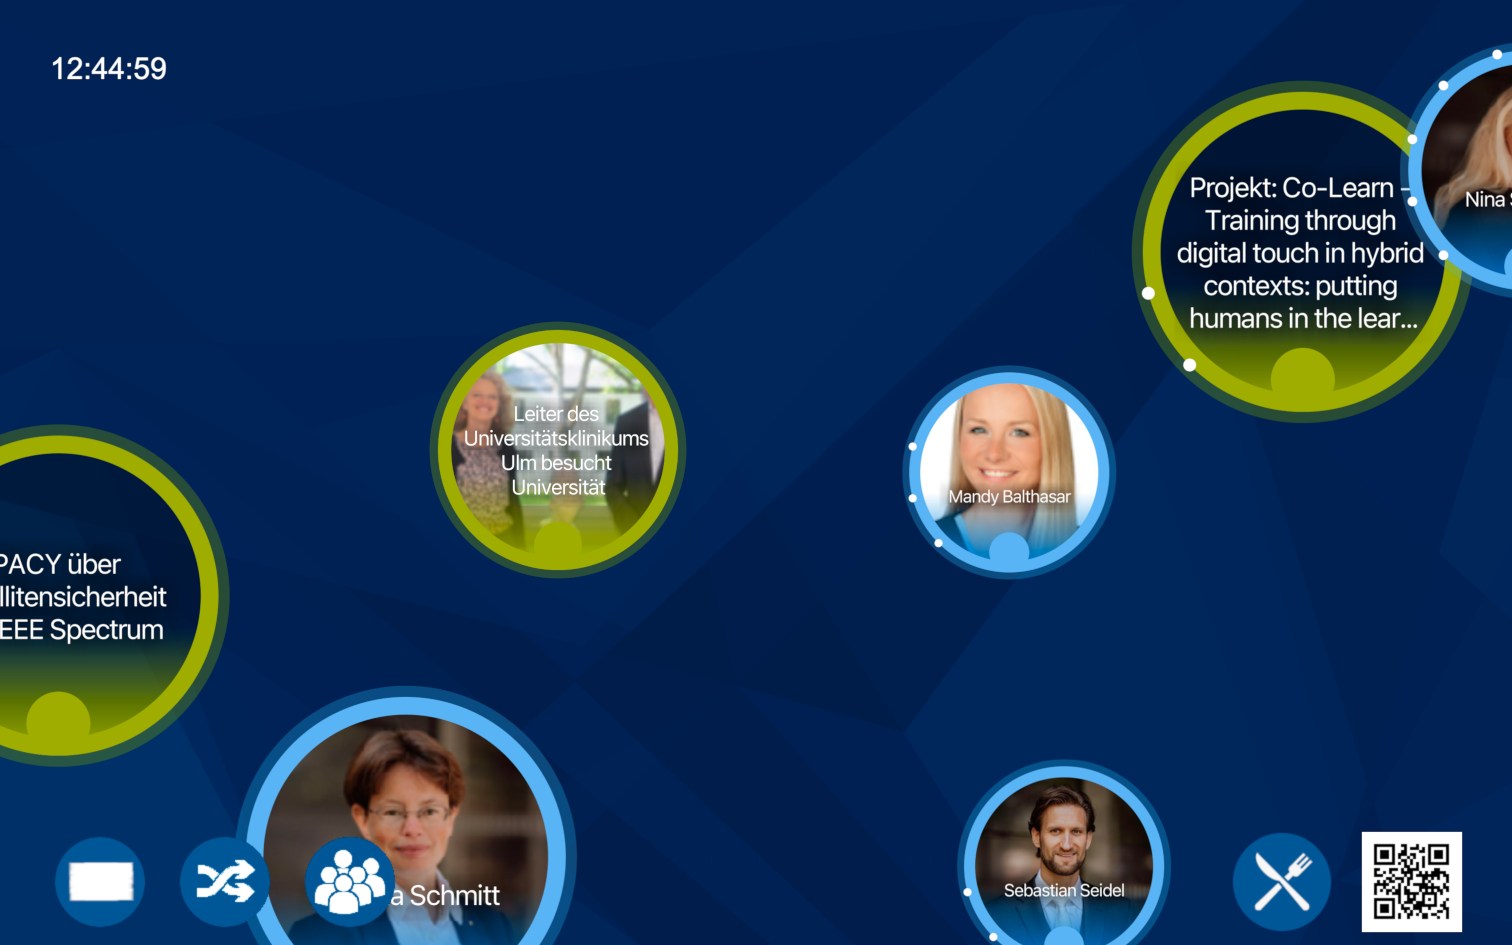
Following a light gamification approach, the users can interact with the flow items – e.g. stop them, drag them around, even throw them out of the border of the screen to disappear.
When a flow item is touched, the movement of the selected item stops, and a detailed view of the item is displayed showing the abstract (in a scrollable window). After some time without interaction, the item cycles back to the non-detailed view and disappears. The detail view not only shows the selected item but also other items that are related to the selected item as a graph (see Figure 2). This graph can be used to navigate to other information.
Additionally, a QR code is displayed in the detail view that can be used to capture the information on a mobile device for later access (by capturing a link to the CommunityMashup).
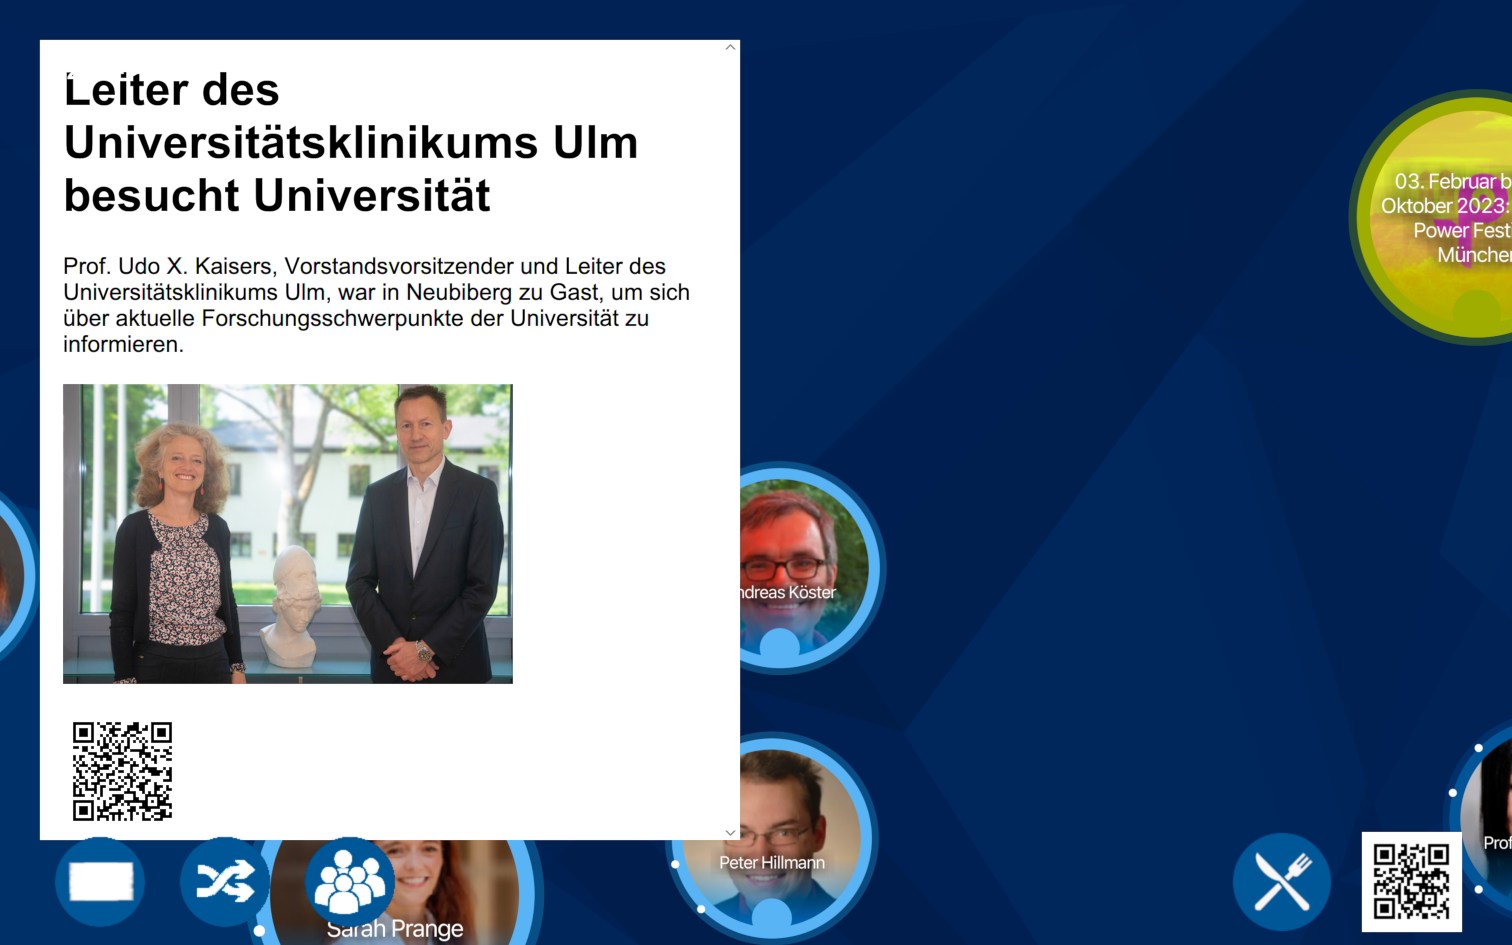
In earlier deployments, we found that the flow works well and addresses both people directly in front of the screen and people watching from a distance (by displaying the flow items in different sizes), but there was something missing. People in the department asked for large posters as they are displayed on paper-only boards. So, we added “teasers” (Figure 3), a poster-like display of the items (quarter to half a screen size) that is shown from time to time. Touching the teaser results in opening the item in graph mode for browsing.
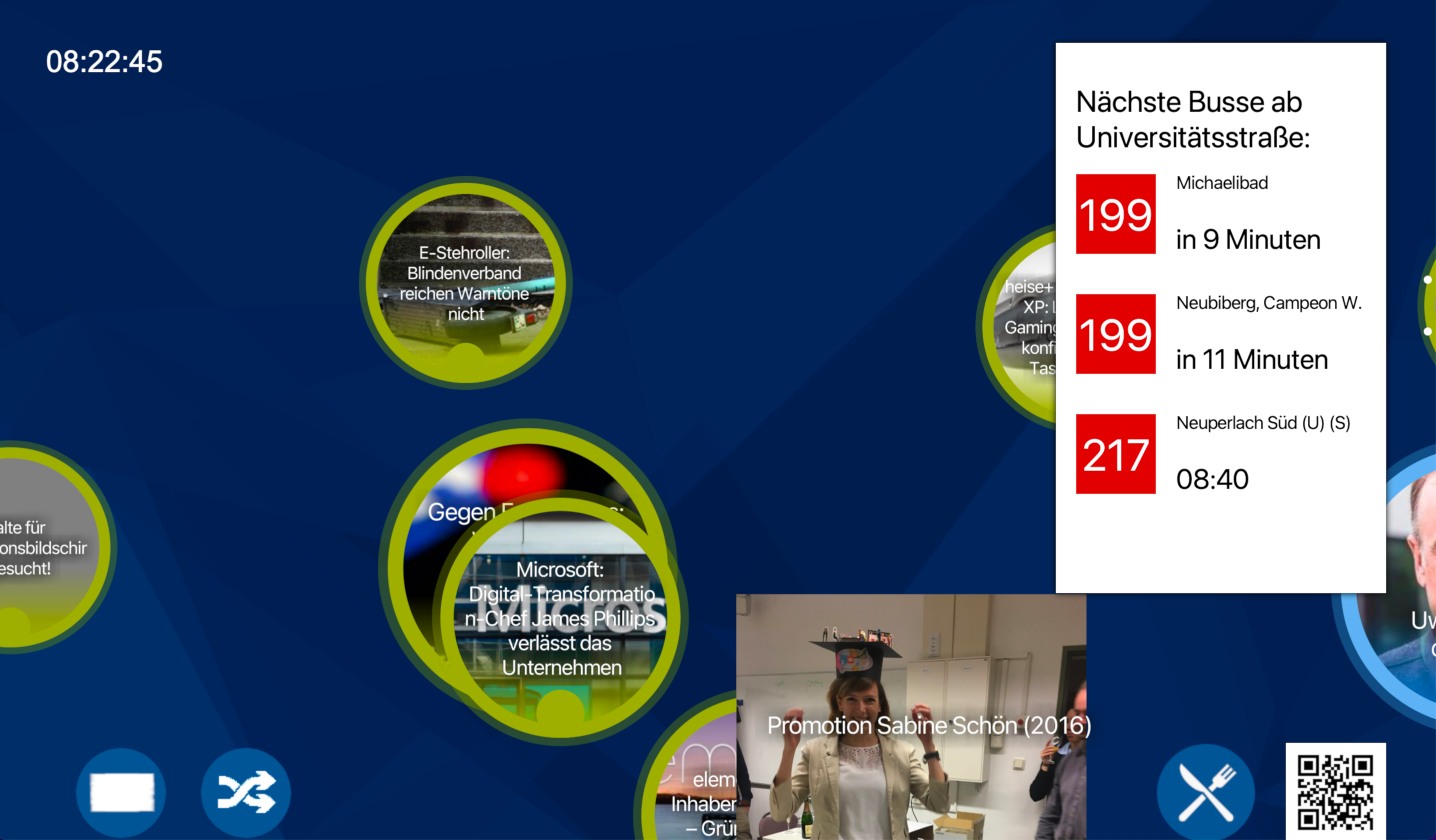
Finally, we added some more static information that is of special interest for the users (Figure 4):
- a clock in the upper left corner
- a possibility to access the cafeteria menu
- a possibility to see the (live) departure times at the nearby bus station
- a possibility to access information about the installation
- a possibility to instantly replace the currently shown flow items (refresh information flow)
- a possibility to replace the currently shown teaser
- a possibility to show all the professors or staff members in the context of a screen location
2.3. Deployment Locations
Looking into possibilities for setting up CommunityMirror instances on campus we identified several locations (mainly based on availability) in the three-floor building of our faculty and one in a satellite campus location:
- Building 41, ground floor: a location where there is a room for workshops with external guests nearby and where there are some bulletin boards for students (showing the results of exams)
- Building 41, first floor: a location in the open staircase
- Building 41, second floor: a location next to a seminar room and coffee kitchen – so, there is traffic by students and staff
- Building CASCADA: a location in the open break room of a research group
We are looking into more locations, but these four seemed to be sufficient for a start.
2.4. Operations Management
The basis of the operation are CommunityMirror applications on different computers that load information objects to display from a CommunityMashup installation and that continously export activity log data to a logging management solution [10] – see Figure 6 for an overview.
The runtime of the CommunityMirrors is scheduled between 7 am and 6 pm during the day. Between 6 pm and 7 am the CommunityMirrors turn into sleep mode to save energy, as it is assumed that no or almost no users would use the screen in the late evening hours or at night.
The first task regarding the management of the network of four (and expandable to more) screens was to set up a deployment script that allows easy updates of the software on the instances without the need to physically visit all of them. Therefore, a git repository was set up that automatically updates itself and the CommunityMirror software (the CommunityMirrorFramework, CMF). To reduce memory-related errors, the computers restart themselves once a day.
The second task regarding management was to build a remote management service for the instances and an application to look into the current status of the instances. To that end, the CommunityMirror software was outfitted with an extensible remote interface that allows remote administrators to access diagnostic information and to trigger system actions (such as a reboot). This remote interaction happened over a direct internet connection for initial tests, which was later improved to use current encryption standards and measures against man-in-the-middle attacks.
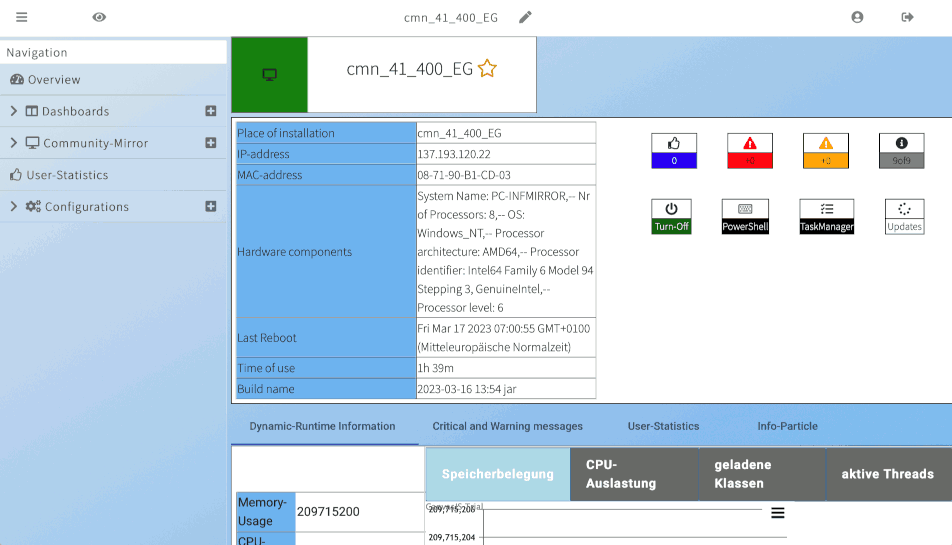
The remote management interface is accessed through a web-based dashboard (Figure 5). It shows an overview and an operation manual for regular tasks, e.g. updating people information items, as we did not yet find a good way to automatically import the information from the people directories at the department. The objective of this application is to enable easier operations management as it also shows information about the current status of the deployments based on our logging framework and integrates an interface for remote management.
The most important issues in management however had to do with the data. As already mentioned in subsection 2.1, we carefully looked into what data to display (to be useful) and how we can obtain the data without too much additional effort. While careful planning and the use of the CommunityMashup solution for automatically collecting data was helpful, it did not do all the work. There was a need to regularly check if there was enough new information and also if it came from enough different sources, and to adapt the import and selection rules or to manually add and update information.
Data management can be divided into two tasks:
- maintenance of existing content
- acquisition of new content
To make maintenance of existing content as easy as possible, we added attributes like an expiration date to the content items and remove them automatically when outdated.
For keeping data like the list of persons and organizations up to date we defined a maintenance process and provided tools to semi-automatically update the information from other information sources (like the faculty person directory).
Adding new content is done mainly via the CommunityMashup. However, we found a need to monitor how much content is available in which categories – and to allow people to suggest content. For the overview we added regular statistics provided by the CommunityMashup that can be accessed in the dashboard solution mentioned before. For suggesting content and for making it easy to maintain the non-automatically collected content (by a large number of users) we added a functional mailbox and a web-based content management system that allows users to easily create content objects.
In addition to checking for “normal” data operation, management includes maintaining data about the operation – as entries in an electronic laboratory journal and as annotations / comments in the logging framework. This additional context data is needed to interpret the raw data in the logging framework when doing evaluations.
3. Discussion
In this paper, we have reported on setting up a long-term evaluation environment for interactive semi-public information displays.
After operating the CommunityMirror network for more than one year now, we can conclude that it actually offers benefits to the users in our department, and provides a powerful environment for public display (action) research.
With the solutions for continuously collecting interaction data [10] and body tracking data around the displays [4], we now have data beyond the novelty effect to work on questions like:
- How do new features, e.g. the employee panel or gamification functionality, influence the interaction with the CommunityMirror?
- What are the information objects users interact with the most – persons, organizations, or content?
- How many people pass by the screen? How do they move between interaction zones? We no longer need to count interactions but can work with conversation rates.
Regarding the effects surrounding the CommunityMirror, we can now have a look at the following questions:
- What are the dynamics between a group of people in front of the screen and how do these groups form (honeypot effect)?
- How can we use body tracking data to observe the honeypot effect? And even further, distinguish between the novelty and honeypot effect and identify a temporal context?
- How can we observe the novelty effect using quantitative logging of body tracking and interaction data?
With our full access solution of a large interactive semi-public information display environment, we have the opportunity to do field studies with full control that allow us to examine these questions, which are interesting for research and operational real world deployment scenarios, e.g. for Computer-Supported Cooperative Work (CSCW).
Additionally, we contribute to “sustainablility” of IT research in practice. Research in applied computing today requires researchers to engage deeply with practitioners in order to design innovative information technology artifacts and understand their appropriation. The problem not yet solved is what happens when the research project is over. See for example Simone et al. [11] for a broader discussion of this topic.